Financial Analytics and Reports
Review observed finance metrics, variance against the same period last year, projections, and export behavior under Reports.
Summary
Use Finances → Reports for the consolidated finance report deck. The page combines an at-a-glance KPI strip, a configurable chart grid, and a compact variance table against the same period last year.
Reports is the current product label. Finance navigation no longer presents separate Analytics or Bank tabs; older destinations resolve to Reports.
Capabilities
Share options and embedded views
Reports itself has no page-level public Share button.
- Export CSV produces a point-in-time variance file.
- Print produces the browser's printable representation.
- A copied Reports URL keeps the reporting parameters, but the reader still needs workspace access.
- You set up public widgets separately as views with restrictions. They are not a public copy of the full Reports deck.
- Assistant public shares are static read-only Assistant snapshots, not live Reports.
- Older embedded finance analytics and bank destinations redirect to the signed-in Reports page. They do not render an independent embed.
Prerequisites
Prerequisites and access
Reports needs:
- signed-in access to the workspace
- connected or imported financial records
- a reporting period that contains data
- a consistent currency when the workspace uses more than one currency
Owners, Members, and Viewers can read workspace report queries. When you edit the grid layout, you change only the browser-local presentation. The layout edit does not change team financial data.
Concepts
Status and comparison meanings
| Display | What it means |
|---|---|
| ▲ / ▼ with a percentage | Current value increased or decreased from the same period last year. Direction alone does not tell you whether the outcome is favorable. |
| pts | Absolute percentage-point change for Profit margin. |
| Avg monthly burn | Arithmetic average of the monthly burn series in the selected period. |
| At current burn | Runway assumes that the modeled burn continues. |
| Across accounts | Eigenn totals cash from the connected account balances. |
| Loading skeleton | The related report query has not resolved yet. |
| Zero | The query resolved to zero, or it found no values to add. It is not a freshness badge. |
For expenses and burn, an increase can be unfavorable even when the arrow points up. Interpret the metric, not the glyph alone.
Data Freshness
- Reports queries the current workspace records for the active date range.
- The page does not show a single report-wide last-sync timestamp.
- Connected bank-account health controls whether cash and recent bank activity are current.
- Classification affects category, expense, merchant, tax, and profit views.
- Large imports or corrected classifications can change historical periods after the page refreshes.
When figures look stale, check Settings → Account → Bank Connections. Then examine Transactions.
Reports versus adjacent finance views
| View | Primary job |
|---|---|
| Overview | Triage owner actions and top financial signals. |
| Finances → Reports | Analyze period metrics, charts, and variance against the same period last year. |
| Finances → Budgets | Enter monthly plan values and compare them with actuals. |
| Finances → Forecast | Model a baseline and assumption-driven cash scenarios. |
| Invoices → Insights | Analyze invoice, aging, payment, and collection behavior. |
An unpaid invoice is not cash. A budget target is not a forecast. A forecast is not an actual.
Workflow
Select the reporting period
Open Finances → Reports, then choose:
- Last 4 weeks
- Last 3 months
- Last 6 months
- Last 12 months
- Month to date
- Year to date
- All time
- Custom range
For Custom range, use From and To.
The selected dates drive the KPI and chart queries. Eigenn reports whole calendar months: a range that starts or ends inside a month includes that whole month. View transactions on a card opens the same whole months.
For comparisons, Eigenn uses the same dates one year earlier. When the period runs into the current month, last year's window stops on the same day.
If To is earlier than From, Eigenn shows an error and hides the figures. Export CSV stays off until the range is valid.
Customize the grid
- Select Edit layout.
- Drag a chart by its handle to reorder it.
- Use the card's width controls to resize it.
- Select Done when you finish the layout.
- In edit mode, select Reset layout to restore the default order and widths.
Changes save automatically on the current device.
Important limits:
- Eigenn stores the layout in that browser's local storage
- it does not follow the user to another browser or device
- it is not a workspace-wide layout
- edit mode reorders and resizes the curated deck. It does not add arbitrary registered charts
- when you clear site storage, Eigenn resets the saved layout
Export CSV
Select Export CSV to download a file named from the active From and To dates.
The CSV contains the same four variance rows as Table, with these columns:
- Change
- Metric
- Same period last year
- This period
- Unit
Amounts have at most two decimals. Unit is the currency code, or % for Profit margin. Profit margin has one decimal.
It does not export the time series behind every chart. Switches between Grid and Table do not change the CSV dataset.
If you need the values on a particular chart, use its source records or a purpose-built export. Do not assume that Export CSV contains them.
Select Print to open the browser print dialog. Eigenn print styles remove the interactive app chrome. You can then print the current report, or save it as a PDF with the browser.
Check the selected period and the current view before you print.
Behavior specification
KPI strip
The five headline tiles are:
| KPI | What it means |
|---|---|
| Revenue | Selected-period revenue, change against the same period last year, and series sparkline. |
| Profit | Selected-period profit, change against the same period last year, and series sparkline. |
| Burn Rate | Average monthly burn across the selected series. |
| Runway | Months of runway at the current net burn: spend minus money received. |
| Cash Balance | Current total across connected accounts. |
Revenue, Profit, and Burn Rate are period-based. Cash Balance is current. Eigenn models Runway from cash and burn. Runway is not a directly observed value.
Grid view
Select Grid to see the default report deck:
- Monthly Revenue
- Profit
- Expenses
- Category Expenses
- Cash Flow
- Burn Rate
- Runway
- Cash Balance
- Revenue Forecast
- Monthly Comparison
- Account Balance Trends
- Top Merchants
- Tax Summary
This mix includes both observed and projected cards:
Primarily observed
Eigenn calculates these cards from recorded workspace data: Monthly Revenue, Profit, Expenses, Category Expenses, and Cash Flow. Eigenn also calculates Burn Rate, Cash Balance, Monthly Comparison, Account Balance Trends, Top Merchants, and Tax Summary from the same data.
Projections
- Runway projects how long current cash lasts at the modeled burn.
- Revenue Forecast projects future revenue. When a fresh canonical scheduled forecast exists, the card uses that calibrated baseline; otherwise it falls back to the report forecast calculation.
Neither card turns a projection into an accounting actual.
Table view
Select Table for four variance rows:
- Revenue
- Expenses
- Profit
- Profit margin
Columns are:
- This period
- Same period last year
- Change
Eigenn derives Expenses as Revenue minus Profit. Profit counts income and spending only: other money received, such as loan proceeds or owner capital, is not profit. Profit margin is Profit divided by Revenue. Currency-row change is a percentage. Eigenn shows Profit-margin change in percentage points.
An em dash in Change means the prior value was zero or a valid percentage comparison is unavailable.
Diagrams
Rendering diagram…
Screenshots
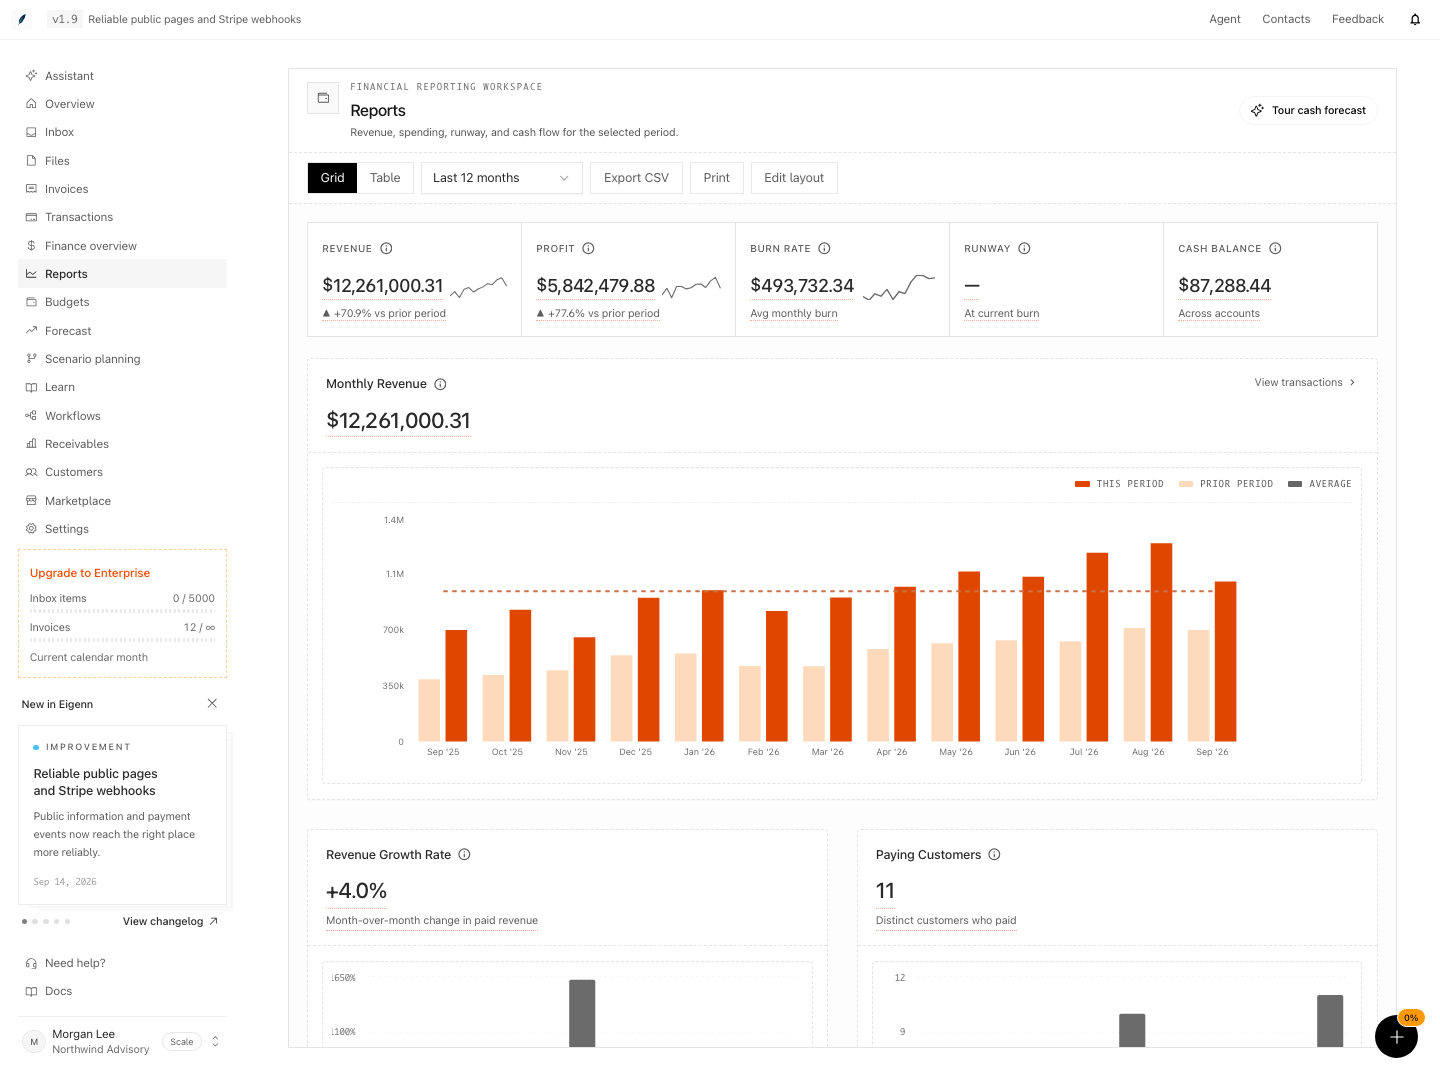
Shown with synthetic data in a local workspace.
Verification
Confirm the Result
Before you use a report in a close or board pack:
- Confirm the date range.
- Confirm the currency.
- Check Cash Balance against the accounts that you turned on.
- Distinguish the observed cards from Runway and Revenue Forecast.
- Switch to Table.
- Confirm that the comparison is the same period last year.
- Export CSV.
- Confirm that the CSV contains the expected four metrics.
- Use Print only after the view that you want appears.
Troubleshoot
A report changed after I categorized transactions
That is normal behavior. Category, expense, profit, merchant, and tax aggregations use the current record classification.
Cash Balance and selected-period Cash Flow do not match
Cash Balance is the current account total. Cash Flow covers inflows and outflows inside the selected period.
My layout disappeared
Layouts are per-device browser storage. A different browser, private window, cleared storage, or another device starts with the default layout.
CSV does not contain the charts
By design, CSV exports the four-row variance table. It does not export the full chart registry.
I cannot find Analytics
Use Finances → Reports. Analytics and older bank-report destinations now resolve there.
I cannot find invoice aging
Use Invoices → Insights or Receivables. The curated Reports deck focuses on central finance performance rather than the full invoice analytics workspace.
- Load Reports and verify that you see KPIs and the chart grid for the selected period.
- Switch periods and confirm that all dashboards update and the comparisons with the same period last year are present.
- Change grid layout (order or size), reload the page, and check your changes persist. Open from a different browser/device to confirm the default layout returns.
- Click Table view and confirm you see Revenue, Expenses, Profit, and Profit Margin, each with This Period, Same Period Last Year, and Change columns.
- Use Export CSV and ensure the downloaded file contains the four summary metrics with a Unit column and matches the period shown in Table view.
- Select Print and verify the print preview shows the current period and view, with app chrome removed.
- Update classifications or import data; refresh Reports and confirm metrics recalculate for affected periods.