Workflow Executions
Watch workflow runs, understand execution and step states, examine replay data, and recover safely from failures.
Summary
Workflow Executions is the operational history for automated and manual runs. Use it to separate queued work from active work. Use it to understand a wait and to find a failed block. Preserve the evidence before you make a recovery change.
Capabilities
You can view and filter execution history, access detailed execution data for each run, monitor live and persisted data, review step-level input/output and errors, identify manual actions required, and analyze idempotency and retry behavior for triggered runs.
Prerequisites
Prerequisites
- Use a Starter or higher workspace.
- Open the feature as a workspace owner through the supported web navigation.
- Create and deploy at least one workflow before you expect a run.
- Use read access only when you do not need to stop a run or act on a checkpoint.
Concepts
Execution States
| State | Description in the current engine | What to do |
|---|---|---|
| Pending | The execution record exists in the queue. It did not start yet. | Refresh before you treat it as stuck. |
| Running | The worker processes the execution. | Open the run for live or persisted step progress. |
| Waiting | The engine stopped at a scheduled wait, subflow poll, terminal pause, or human checkpoint. | Examine the current node and the Action Required section. |
| Completed | The engine reached a successful terminal outcome. | Confirm the result and the side effects when the run matters financially. |
| Failed | The execution recorded an error. | Preserve the error and failed step, then follow the recovery guide. |
| Canceled | The engine recorded a cancellation. | Start a new run if the work still needs to happen. A canceled run does not resume. |
The list calculates duration only when both start and completion timestamps exist. If not, it shows In progress. This also applies to some records that are not in the Running state and have no completion timestamp.
Workflow
Open Execution History
Choose Workflows in the primary sidebar. Then choose the Executions secondary tab. You can also choose View Executions from the Workflows page or View All in a workflow’s Recent Executions section.
The list loads the newest 50 executions that match. It has no next-page control in the current web view.
Use the filter menu to narrow the list:
- Workflow filters by one of the first 100 loaded definitions.
- State filters by execution state.
You can also search executions by workflow name. Select a chosen option again to clear it.
While any listed run is not yet in a terminal state, the page refetches every five seconds. When every listed run is terminal, the page stops polling. Use Refresh to request the list on demand.
The table shows Workflow, State, Trigger, Started, Duration, and Error. Select the workflow value in a row to open Execution Details.
Read Execution Details
Header and metadata
The page shows Status, Trigger, Started, and Duration, plus View Workflow. A failed run with an execution-level error also shows Execution Failed.
Record the full execution ID from Execution Replay before you troubleshoot. The breadcrumb shows only its first eight characters. The full ID is the best identifier for support and audit follow-up.
Action Required
When the run has a pending human checkpoint, Action Required shows its message, node, expiry, and Resume or Cancel actions. Choose View All Pauses to open the checkpoint dashboard.
Read Workflow Pauses before you use either action. A resume that returns queued enqueues the continuation job. A checkpoint that is already resumed, expired, or canceled returns that state instead and starts nothing.
Execution Graph and Execution Replay
When the stored definition parses successfully, Execution Graph renders a read-only copy of the workflow with execution overlays. Execution Replay orders persisted steps chronologically and shows:
- execution and step status,
- the current node,
- visited paths,
- timestamps and durations,
- skipped steps,
- step errors, and
- input or output where present.
Step states are Pending, Running, Completed, Failed, and Skipped. They are separate from the execution-level state.
Live and persisted data
The detail page combines persisted execution steps with realtime worker events when realtime credentials are configured. The page reports one of three states below the graph:
| Message | Meaning |
|---|---|
| Live updates enabled. | The page is receiving realtime worker events. |
| Live updates paused: followed by an error | The realtime connection failed. The message states why. |
| Live updates are waiting for the execution to start. | Realtime is not active yet, because the run has not started. |
A hosted customer must not create or show a worker API key in the browser. If live updates stay paused in a hosted workspace, use Refresh, then contact support. A self-hosted operator sets the worker URL and the public worker credential deliberately, and must know that the browser receives a NEXT_PUBLIC_ value.
Even without live updates, the page can replay persisted steps returned by the execution query.
What this run was working on
This card resolves the run to the records it touched, such as the customer and the invoice. When the run hydrated no such record, the card says so and shows only the raw payload.
When a result summary exists, the card states the verdict of the run above the raw data.
Three collapsed disclosures hold the raw JSON, shown only when the object is present:
- Raw trigger data explains what started the run.
- Raw execution context shows the accumulated runtime context.
- Raw result shows the recorded final result.
These objects can contain customer, invoice, or integration data. Share only the minimum necessary excerpt when you troubleshoot. Remove credentials and secrets.
Behavior specification
Retry and Idempotency Behavior
The editor’s manual Run action does not send an idempotency key. Treat each click as a potential new execution.
A workflow trigger integration request accepts an optional idempotency key of 1 to 128 characters. Eigenn scopes the key to the team and the workflow. If you use the same key again, Eigenn returns the same queued or completed job and execution. Eigenn does not create a duplicate. Integration tests cover both active and completed jobs.
Current worker configuration includes:
- up to 3 tries for an execution-start job,
- up to 25 tries for a resume job, and
- a dead-letter recovery path with up to 3 more retries and exponential delays that start at one hour.
Those values are implementation settings, not a completion SLA for the customer. The web execution page does not show the try count and the dead-letter state as controls. Examine a visible Failed state, even when a background retry can still happen.
Cancellation
The editor turns Run into Stop for the run that it now tracks. Stop submits an execution cancellation.
The execution history and detail pages do not show a general Cancel execution or Retry button. Cancel Pause changes a checkpoint record. It is not the same operation as a cancellation of the execution.
Diagrams
Rendering diagram…
Screenshots
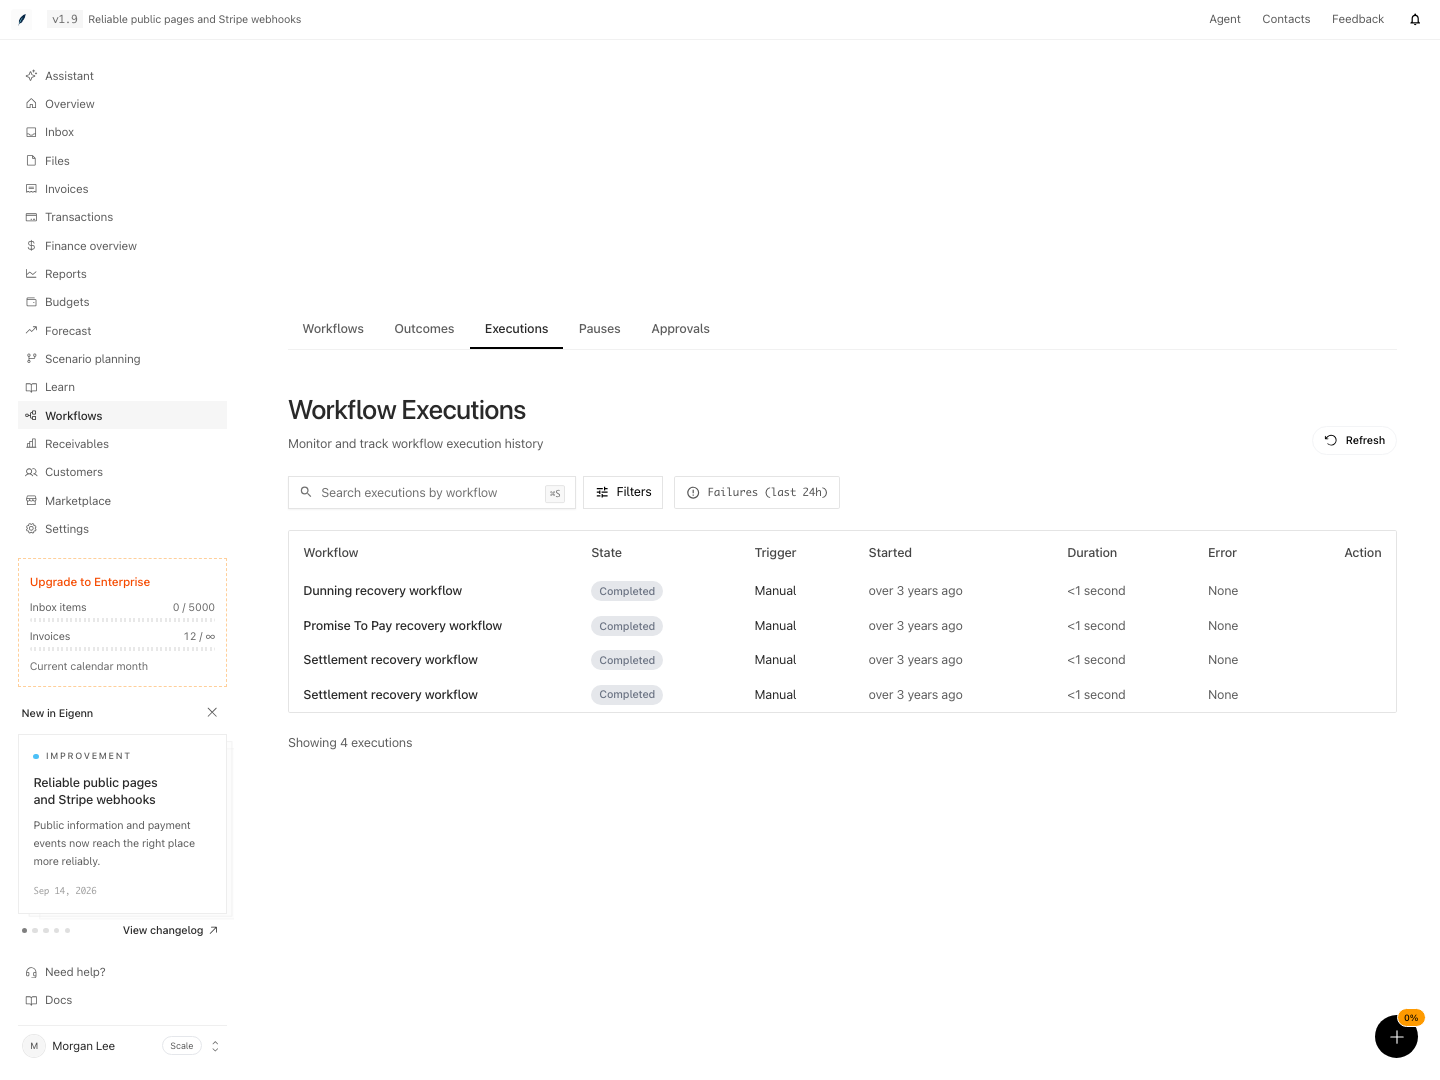
Shown with synthetic data in a local workspace.
Verification
Confirm a Run
- Open Workflows → Executions.
- Choose Refresh.
- Find the run by workflow, trigger, and start time.
- Open Execution Details.
- Confirm the execution-level state.
- Compare the current node with Execution Replay.
- Expand the failed or unexpected step.
- Examine its input, output, and error.
- Confirm that the trigger data matches the record that you intended to process.
- Confirm the external side effect in its authoritative system. A completed step does not replace provider-side confirmation.
Troubleshoot
A run remains Pending
Choose Refresh. Wait for a possible queue delay. If the run does not start, capture the execution ID, workflow ID, queued time, and current state for support.
A run remains Running but the graph does not move
Check the live-update message. If realtime has the disabled or paused state, reload the page to fetch persisted steps. If the state and the persisted steps do not change, escalate with the execution ID.
A run stays in the Waiting state
Examine its current node. A Wait block has a time-based resume. A Pause block creates Action Required. Do not resume a checkpoint only to clear the queue. Read its message and expiry first.
A run failed
There is no manual retry control on this page. Preserve the failure. Examine the definition. Deactivate the workflow before a major edit when this is applicable. Correct the workflow. Deploy the workflow.
Then create a new manual run. The original execution remains the audit record.
The page does not show workflow names
The page cannot load the definitions and shows definition IDs instead. The executions can still be available. Refresh the page. Then check the workspace plan and the read permissions.
A completed run has no visible result
The result is optional. Use the step replay. Then confirm the action in the product or provider that owns it.
- Open Workflow Executions and refresh the list; verify the desired run appears with expected state.
- Filter or search by workflow name and confirm accurate results.
- Click any run to open Execution Details and confirm metadata displays (status, trigger, start time).
- Check for Action Required if a checkpoint is waiting; if so, confirm message and available actions.
- Review Execution Replay to see the sequence of steps, including any errors or skipped steps.
- Test live updates by observing changes in real-time for in-progress runs; if unavailable, confirm fallback to persisted data.
- On failed or completed runs, expand steps to inspect input, output, and errors.
- Compare trigger data and results with the originating record to verify correctness.
- For canceled runs, confirm final state and absence of retry/continue controls. 10. For ambiguous results, manually confirm side effects in the external system (e.g. provider, customer record).