Stress Tests
Compare a cash-flow baseline against a scenario with revenue, spend, headcount, collections, and FX assumptions.
Summary
Stress tests live in Forecast. The workbench calculates a no-driver baseline and an active scenario from the same workspace history. It then shows how the assumptions change cash, runway, revenue, expenses, and breach risk.
A stress test is a model, not a budget and not a replacement for observed bank, transaction, or invoice data.
Capabilities
You can use the stress test workbench to build and compare various forecast scenarios, adjusting assumptions like revenue shocks, changes to expenses, hiring plans, delayed collections, and FX movements. The system calculates risk badges, runway, and breach probabilities for each setup. Save, run, and reload scenario definitions for ongoing planning.
Prerequisites
Before You Start
You need:
- an Eigenn workspace with revenue and expense history
- bank accounts that you turned on, for the initial cash
- Owner or Member access to run forecasts and manage saved scenarios
- workspace billing access that permits changes
A Viewer cannot run a forecast or change saved scenarios. If the page shows Forecasting isn't enabled for this workspace yet, ask an Owner to check your workspace role and billing access. This message can appear for an access denial; it does not identify the cause by itself.
Concepts
What the baseline uses
Eigenn derives the baseline from:
- workspace revenue and expense history from the start of the month 24 months ago through today
- current balances from the bank accounts that you turned on
- the selected reporting currency
- calibrated uncertainty when completed calibration data exists
The workbench automatically runs the baseline and scenario. There is no separate Run forecast button for unsaved assumptions: after you change a lever, the scenario refreshes automatically.
Select a horizon of 6 months, 12 months, or 24 months. The workbench runs 1,000 simulations for each displayed probabilistic scenario.
Run history
Run history shows up to eight recent persisted forecast runs returned for the workspace. Each completed run can show Runway P50, Min cash P10, and Breach.
Non-completed runs show their stored status.
Model health
The model-health panel reports the accuracy of the forecast separately for the revenue series and the expenses series. A weekly backtest produces each record.
| State | Meaning |
|---|---|
| Calibrated | The latest backtest completed within the last 14 days |
| Calibration stale | The latest backtest completed, but more than 14 days ago |
| Calibration failed | The latest backtest did not complete |
| Insufficient history | The backtest cannot evaluate the series |
| Not calibrated | No backtest record exists for the series |
A calibrated series also reports its backtest window, the run date, and these metrics:
| Metric | Meaning |
|---|---|
| MAPE | Mean absolute percentage error |
| sMAPE | Symmetric mean absolute percentage error |
| Band coverage | Share of actual values that fell inside the predicted interval |
| RMSE | Root mean squared error |
| Holdout | Months held back from fitting to test the model |
| Uncertainty scale | Multiplier applied to the modeled spread |
Read band coverage before you rely on P10 and P90. Coverage far below the interval width means the bands are too narrow for the current data.
An unsaved workbench scenario that refreshes automatically is not proof that Eigenn created a persisted history row.
Workflow
Build an active scenario
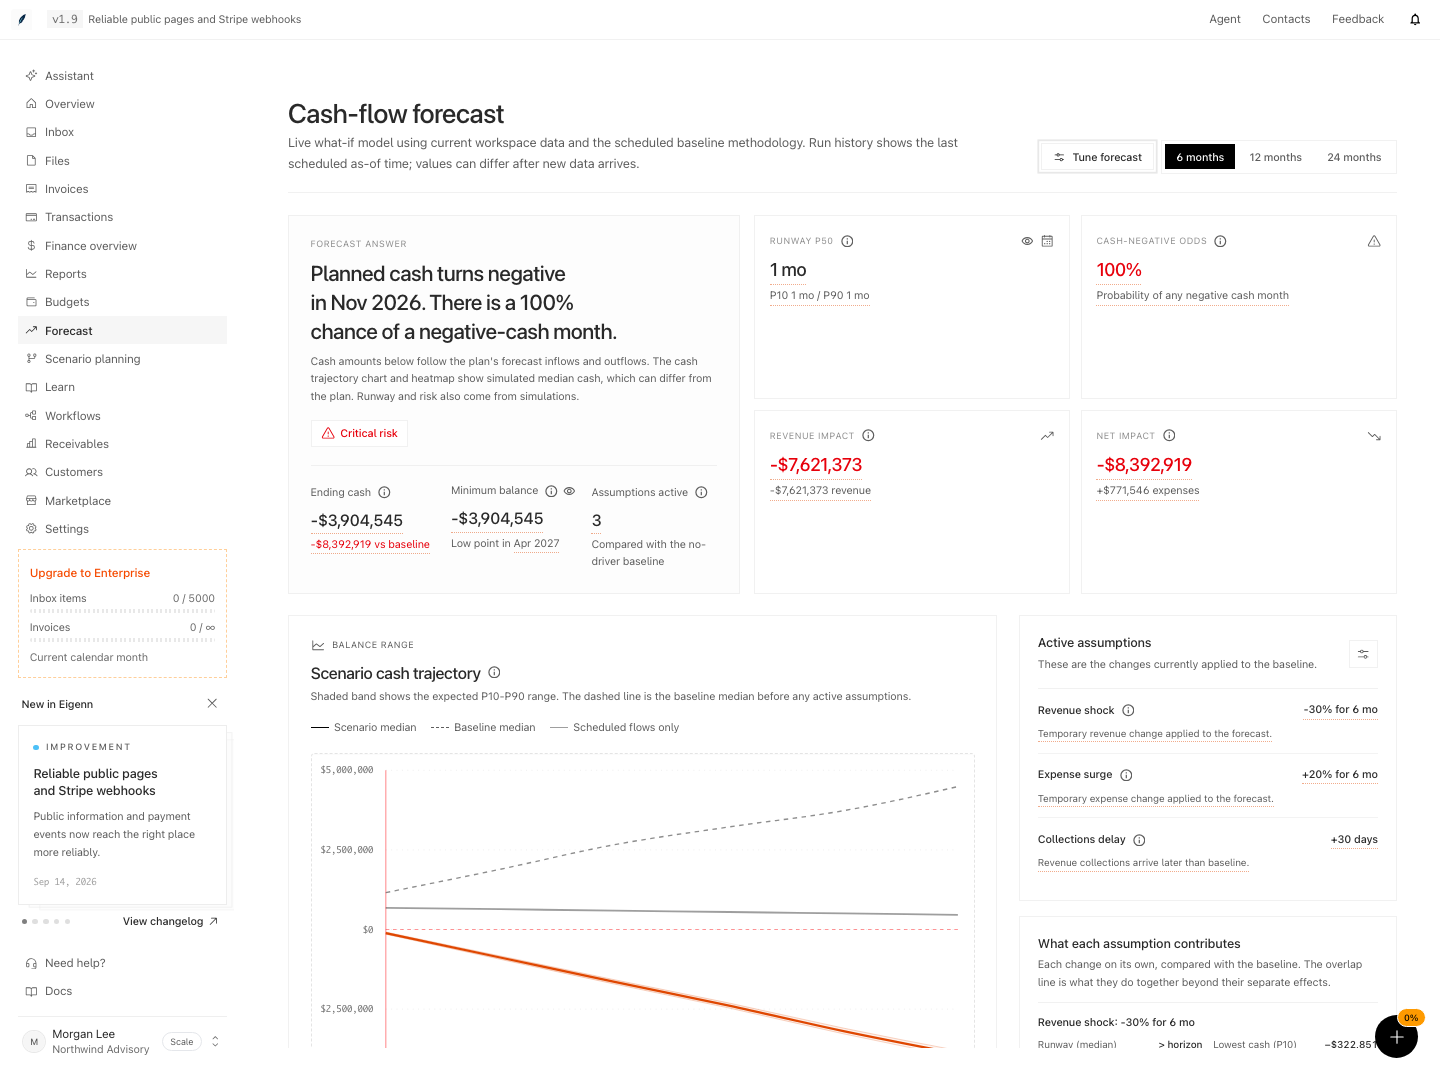
Select Tune forecast to open Scenario assumptions. The badge shows how many assumptions differ from the baseline.
Revenue
| Lever | Supported range | Description |
|---|---|---|
| Revenue shock | -80% to +80% | Temporary revenue change, with Duration and Starts after controls. |
| Revenue growth | -20% to +20% per month | A sustained change to the revenue trend that compounds. |
| Clients cancelling | 0% to 20% per month | Customer attrition that compounds. It can start after a delay. |
Team
Headcount change supports -20 to +20 people. Set Cost per hire / month, Starts after, and Ramp months. A negative headcount change models a lower monthly cost. A positive change models new hires.
Spend
- Expense surge supports -50% to +100%, with duration and start-offset controls.
- One-time expense adds one positive cash outflow on a selected date.
Collections
- Collections delay moves expected collections up to 45 days later.
- Collections acceleration moves expected collections up to 45 days earlier.
- Recovery rate change changes the recoverable share of overdue revenue by -20% to +20%.
FX
FX shock supports -50% to +50%. Enter a three-letter currency. Then select Sticky or Spot. The model estimates foreign-currency exposure from the balances of the bank accounts that you turned on. If the workspace has no relevant exposure, the FX lever can have little or no visible effect.
Select Reset beside one lever or Reset all assumptions to return to the baseline.
Quick presets
Quick presets replace the current lever set with a complete scenario:
| Preset | Applied assumptions |
|---|---|
| Revenue drop | Revenue decreases 20% for three months. |
| Expense spike | Expenses increase 15% for three months. |
| Hiring plan | Adds two hires that start after one month. The ramp is three months at the default loaded monthly cost. |
| Slow collections | Collections arrive 21 days later. |
| Collections recovery | Collections arrive 15 days earlier. |
| Defensive cost plan | Models two fewer people and no revenue-growth lift. |
| Severe stress test | Revenue falls 30%, expenses rise 20%, and collections slip 30 days for six months. |
After you apply a preset, adjust individual levers if the decision needs more specific assumptions.
Model observed payment behavior
Model real payment behavior is on by default. Leave it on to shift expected collections with each customer's observed payment lag and promise reliability.
When you apply this option, the chart shows:
- number of invoices adjusted
- total cash shifted between months
- reliability haircut
This is still a forecast overlay. For the source invoice status and collection analysis, use Invoices → Insights and Receivables.
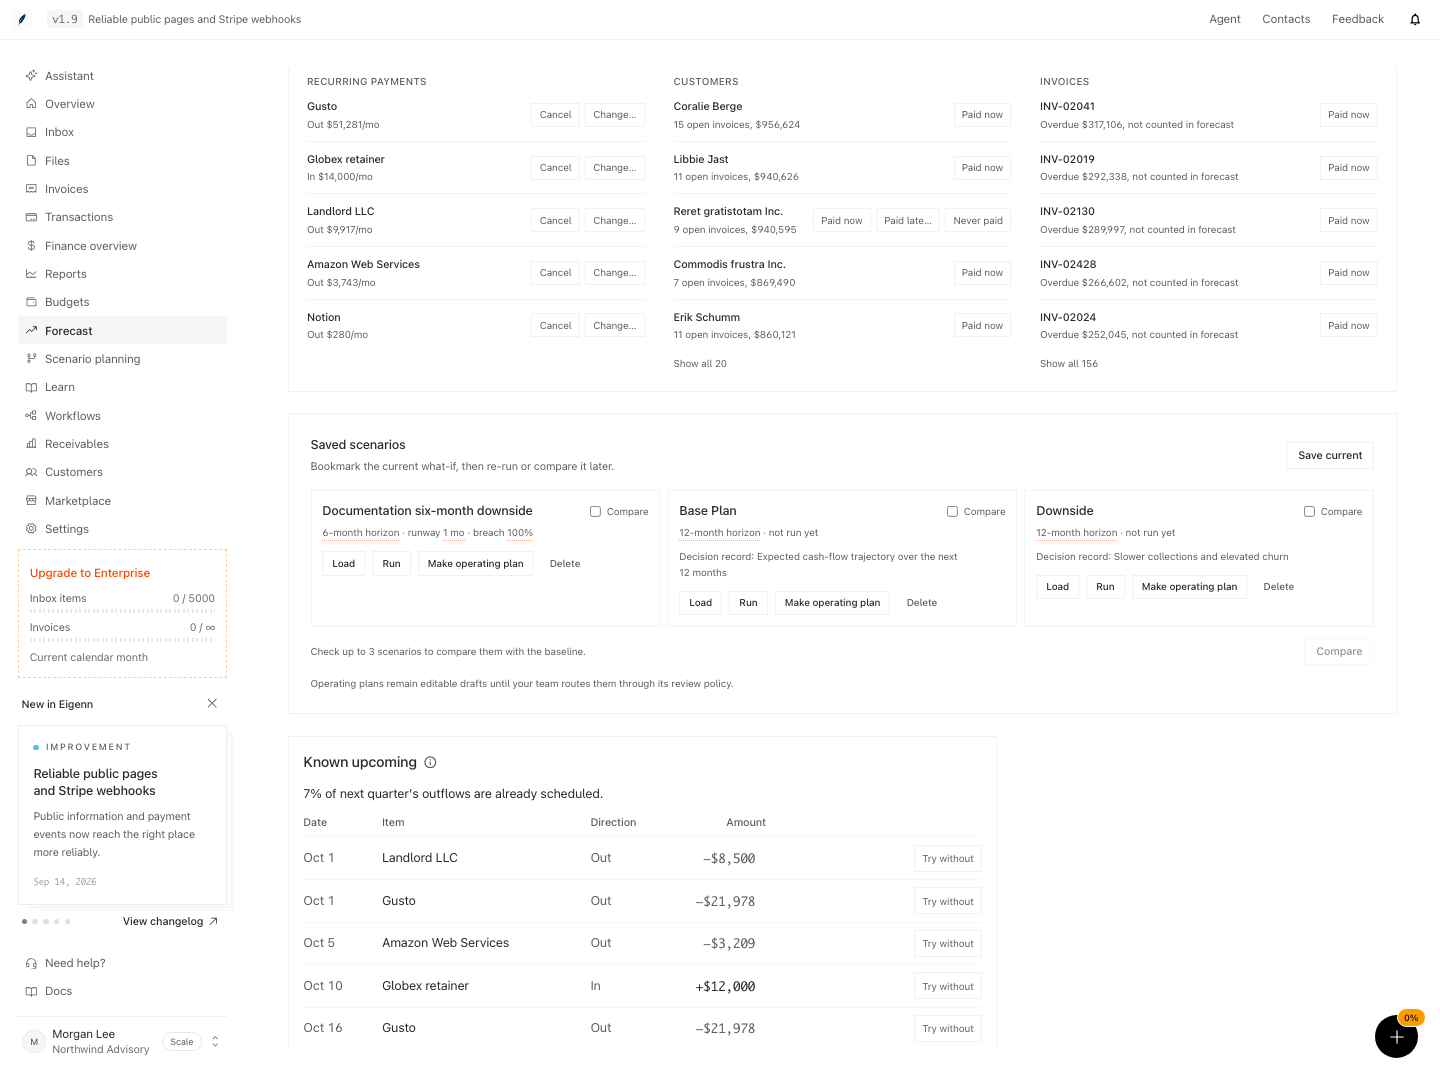
Save and re-run a scenario
- Engage at least one assumption.
- Select Save current in Saved scenarios.
- Enter a name of up to 200 characters.
- Select Save.
A saved row shows its horizon and either not run yet or its latest summary.
- Load restores its drivers and horizon into the workbench.
- Run recalculates it against the latest history and updates the saved summary.
- Delete permanently removes the saved scenario.
If you change levers in the workbench, Eigenn does not update a saved scenario. Save a new named scenario when you want to keep a different assumption set.
Saving keeps the drivers and horizon, not a snapshot of the chart or the Model real payment behavior toggle. Load restores those drivers and the horizon into the live workbench. Run uses the saved simulation settings and a fresh lookback window; its saved summary can differ from the live chart.
The same browser tab remembers unsaved assumptions when you revisit Forecast. Select Tune forecast → Reset all assumptions to return to a no-driver baseline. A saved scenario remains in the workspace until you delete it.
Behavior specification
Read the result
Forecast answer
The headline states whether planned cash stays at or above zero across the horizon or names the first month planned cash turns negative. Planned cash applies forecast inflows and outflows once. The cash trajectory chart and heatmap show simulated median balances, which can differ from the plan.
The risk badge uses the probability of any negative-cash month:
| Badge | Probability |
|---|---|
| Low risk | less than 10% |
| Moderate risk | 10% to less than 25% |
| High risk | 25% to less than 50% |
| Critical risk | 50% or more |
Cash and runway figures
- Ending cash is the planned final balance of the active scenario. The delta compares it with the baseline plan.
- Minimum balance is the plan's low point, including starting cash, and its assigned month.
- Runway P50 is the median outcome.
- P10 is the more conservative runway outcome.
- P90 is the more favorable runway outcome.
- A value such as >12 mo means cash did not breach within the selected 12-month horizon. It does not mean that the runway has no limit.
- Cash-negative odds is the probability of at least one negative-cash month across the horizon.
Scenario cash trajectory
The solid scenario line is the median. The shaded region is the expected P10-P90 range. The dashed line is the no-driver baseline median.
If the chart says Not enough history to forecast, the engine cannot build a usable series from the current workspace data.
Pressure states
The owner decision view labels each month:
| State | Description |
|---|---|
| Stable | Cash-negative odds are below 10%, net-negative odds are below 25%, and median cash remains nonnegative. |
| Watch | Cash-negative odds reach 10%, or net-negative odds reach 25%. |
| High | Cash-negative odds reach 25%, or net-negative odds reach 50%. |
| Critical | Median cash is negative, cash-negative odds reach 50%, or net-negative odds reach 75%. |
Use Cash runway decision timeline, Scenario comparison matrix, and Cash pressure by month to find when a decision becomes urgent.
Baseline, active plan, and defensive plan
The comparison matrix keeps three rows separate:
- Baseline: no assumptions
- Active plan: the levers that you apply now
- Defensive plan: Eigenn's lean-team preset
The defensive-plan action replaces the current lever set. It does not edit a budget or approve a business decision.
What stress tests do not change
A stress test that you run or save does not:
- edit transactions or invoices
- change connected bank balances
- create or revise budgets
- post forecast values as accounting actuals
- create a public or embedded report
Eigenn encodes the scenario in the URL state of the Forecast page. A copied link can restore the assumptions for another signed-in teammate. The recipient still needs workspace and forecast access.
Diagrams
Rendering diagram…
Screenshots
Verification
Confirm the Result
Before you use the result in a decision, confirm:
- the horizon covers the commitment that you evaluate
- Assumptions active matches the levers you intended
- the active-assumptions summary contains the right amounts, dates, percentages, and delays
- baseline and active plan use the same currency and horizon
- you examined P10, P50, P90, and cash-negative odds, not only the median
- the decision remains acceptable in the first Watch, High, or Critical month
Troubleshoot
Forecast is unavailable
Confirm that you are an Owner or Member and that the workspace has billing access for changes. A Viewer cannot run a forecast. The unavailable message does not distinguish these access failures.
The result stays on placeholders
After you change the horizon or assumptions, wait for all three comparisons to finish. If the placeholders stay, reset the assumptions. Then reload the page. Then check that connected cash and history are available.
A lever does not change the result
Confirm that Assumptions active counts the lever. A one-time expense needs both a positive amount and a valid date. An FX shock needs a currency, a nonzero change, and relevant foreign-currency exposure.
Saved scenario says not run yet
Select Run on that saved scenario. A save keeps the definition. A run calculates and stores the latest summary.
Runway shows greater than the horizon
Increase the horizon from 6 to 12 or 24 months if you need a longer view. The label tells you only that no breach happened inside the selected horizon.
- Open Forecast as an Owner or Member and confirm that the chart contains history.
- Use Tune forecast → Reset all assumptions to check the no-driver baseline.
- Apply Severe stress test and confirm three active assumptions: revenue down 30%, expenses up 20%, and a 30-day collection delay.
- Save a named scenario. Its row should initially say not run yet.
- Select Run and confirm that the row shows runway and breach results. Reload the page and check that the summary remains.
- Reset the live assumptions, change the horizon, then select Load on the saved scenario. Confirm that its drivers and horizon return.
- Review P10, P50, P90, cash-negative odds, and the baseline comparison before making a decision.