Receivables Analytics
Interpret collection performance, aging movement, and payment speed with the correct period, denominator, and currency limits.
Summary
Receivables Analytics is the deeper collection-performance view behind the Receivables overview. It separates effectiveness signals from aging and payment-speed signals. You can then diagnose why cash arrives earlier or later.
Capabilities
Review collection performance, aging snapshots, payment timing, reminder and template outcomes, retry results, promises, and card-expiry exposure. Use these signals to select invoices for investigation. The page does not itself reconcile payments or change collection policy.
Prerequisites
Before You Start
- Confirm that you selected the correct team.
- Correct invoice issue, due, sent, paid, and status dates before you read the speed metrics.
- Record payments and customer links consistently.
- Choose one reporting period for the review.
- Reconcile multi-currency balances outside the dashboard before you use the results for financial reporting.
Concepts
Collections Performance
Collection Curve
Collection Curve follows invoices issued in the selected period, using creation date when issue date is missing. It counts invoices with a first successful payment by each day from 0 through 90 after issue. The denominator includes all invoice statuses. A first partial payment counts; full settlement is not required. Payments before issue or after day 90 do not increase the plotted curve.
The current display has a scaling limitation: the returned fraction is shown with a percent sign without multiplying by 100. A fraction of 0.5 can appear as 0.5% instead of 50%. Use source invoice and payment counts before reporting a percentage. A team with no qualifying invoices can show a flat zero series.
Collection Effectiveness
Collection Effectiveness uses the selected issue-date period, with creation date as the fallback:
paid invoice count ÷ count of paid, unpaid, and overdue invoices × 100
Draft, scheduled, and canceled records are excluded. It counts records equally; it does not weight by invoice amount or require a successful payment-ledger entry when the invoice is already marked paid.
Collection Effectiveness Index
Collection Effectiveness Index (CEI) divides successful invoice-payment amounts captured in the period by opening receivables plus period sales minus closing receivables, then multiplies by 100. Sales use positive transaction amounts. The receivables terms use invoices that are currently unpaid or overdue and have no paid date; they are not historical snapshots of each boundary date.
The headline can exceed 100%, while the collected/outstanding bar is capped at 100%. If the denominator is not positive, the result is unavailable; the current card can still display 0% for that case. A zero is not sufficient evidence of poor collection. These figures need reconciliation before use outside an operational review.
Recovery Rate
Recovery Rate shows cumulative successful payment amounts divided by cumulative invoice amounts, by month within the selected period, capped at 100%. Invoice amounts use issue dates, falling back to creation dates, and include all statuses; payment amounts use capture dates and can relate to invoices issued earlier. The headline averages the displayed monthly percentages without amount weighting. These bars are months, not aging buckets.
Aging and Payment Timing
Aging Movement
Aging Movement compares stored aging snapshots on the exact start and end dates. Its buckets are Current, 31–60, 61–90, 91–120, and 120+. Missing snapshots are treated as zero. The current chart suppresses negative changes and sums only positive changes in its headline. It cannot show net movement or prove that balances did not decline. Verify that both snapshots exist before interpreting the result.
Payment Lag
Despite the card's due-date wording, Payment Lag measures whole calendar days from invoice issue to its first successful payment. Creation date substitutes for missing issue date. The selected period filters issue dates, not payment dates. The card shows the rounded average, median, and 90th percentile. First partial payments qualify, and the query does not restrict invoice status. It excludes payments before issue. No qualifying payment produces an empty state.
Days Sales Outstanding
Days Sales Outstanding (period) divides average opening and closing receivables by positive transaction amounts in the period, then multiplies by the inclusive number of days. Its receivables inputs use currently unpaid/overdue invoices without a paid date, bounded by issue date or creation date. They do not reconstruct historical paid states. With no positive sales denominator, the card has no result.
Days to Pay
Days to Pay (DSO) averages elapsed days from issue to the invoice's paid date, using creation time when issue date is absent. It includes invoices marked paid whose paid date falls in the selected period. The subtitle gives the number of paid invoices. This differs from Payment Lag's issue-date cohort and first successful payment, and from the transaction-based DSO calculation.
Dunning Performance
| Card | What to read | Limits |
|---|---|---|
| Recovery by Reminder | Recovery rate by policy step, with the best step as the headline | Sends are selected by send date. A paid invoice is attributed to its most recent communication within 14 days before its paid date. This is attribution, not evidence that the message caused payment |
| Template Performance | Recovery by channel, template name, and recorded version | Uses the same 14-day attribution. Groups with fewer than 20 sends are hidden; the headline shows the best remaining rate. It is not a controlled experiment |
| Retry Recovery | Success rate by attempt number; the headline counts attempts | Attempt zero is the original try. The rate uses succeeded ÷ (succeeded + failed), excluding pending attempts. The selected period uses attempt creation dates |
| Why Payments Fail | Provider failure reasons, exposed amounts, and later recovery | Selects failed attempts created in the period. Amounts use invoice face value; an invoice can appear under several failure reasons. Recovery follows the invoice paid date being present, not a proof that a particular retry succeeded |
Reminder attribution also uses invoice face value. Recovery by Reminder joins current policy steps, so removing a step can remove its sends from that grouping. Template results depend on the template/version stored with the communication. The failure-reason headline sums groups and can count the same invoice more than once. Inspect invoices and provider records before drawing conclusions about cash recovered or which message performed best.
Promises and Payment Risk
| Card | What to read | Time and population |
|---|---|---|
| Promise Reliability | Kept, broken, open, and canceled promises; kept-rate headline | Groups promises by creation month in the selected period. Kept rate uses kept ÷ (kept + broken), excluding open and canceled promises |
| Promised Cash | Face-value open promises and discounted expected cash | Selects open promises by due date in the period. Discounts by the team's all-time kept rate; uses 50% when no resolved history exists. The headline sums expected amounts |
| Card Expiry Exposure | Customer revenue associated with expiring payment methods | Uses today, not the reporting period: includes already expired methods, the current month, and the next six months. Exposure uses trailing-12-month paid invoice amounts |
Promised Cash is an estimate, not a payment commitment guaranteed by Eigenn. Card Expiry Exposure can count a customer's revenue more than once when they have multiple expiring methods; the headline customer count sums monthly counts. It does not prove that every expiring method is the customer's active default.
Period and Currency Reference
| Metric group | Selected-period basis | Currency handling |
|---|---|---|
| Collection Curve, Collection Effectiveness, Payment Lag | Invoice issue date, with creation-date fallback | No currency filter in these requests |
| Days to Pay | Invoice paid date | No currency filter |
| DSO and CEI | Transaction dates plus the boundaries described above | The requested currency can convert the transaction side; invoice and payment totals remain raw |
| Recovery Rate | Invoice issue dates and successful payment capture dates | Currency is a display label; the query does not convert amounts |
| Aging Movement | Snapshots on the two exact dates | No currency conversion |
| Reminder and template performance | Communication send date | No currency filter |
| Retry Recovery and Why Payments Fail | Payment-attempt creation date | No currency filter |
| Promise Reliability / Promised Cash | Promise creation date / due date | No currency conversion |
| Card Expiry Exposure | Today and trailing paid history | Independent of the selected period; no currency conversion |
The page's visible control selects a period, not a currency. Some cards also read a currency already present in the reporting URL. A currency label does not prove that every amount was converted. All time starts on January 1, 2020; use a custom range when earlier records matter.
Workflow
Open Receivables Analytics
- Open Receivables.
- Select Analytics.
- Choose a reporting period or Custom range.
- Review Collections performance first.
- Continue to Aging & payment timing, Dunning performance, and Promises & payment risk.
Recommended Review Sequence
- Select the period and record DSO, CEI, payment lag, and the final collection-curve percentage.
- Compare issue-date and paid-date cohorts separately; check the Collection Curve scaling limitation before quoting its percentage.
- Examine monthly Recovery Rate bars, reminder/template outcomes, and payment-attempt results.
- Confirm snapshot dates before reading Aging Movement; review promises and card-expiry exposure separately.
- Return to Receivables → Overview.
- Examine current AR Aging and Do next.
- Open Invoices and confirm the records that drive the change.
Behavior specification
Data and Currency Limits
- Many cards can return an empty state for a new team or a period with no qualifying records. Some query failures also use the empty state, so confirm loading and source data before assuming the population is empty.
- A zero with no population behind it is not proof of good performance.
- Cards without a currency input can aggregate values without a user-selected currency filter.
- Current invoice aggregates can combine raw amounts from many currencies under one displayed currency.
- Customer, invoice, and payment dates set the metrics. A bank transaction alone does not repair a missing paid date or status.
- Analytics are operational indicators, not GAAP, tax, or statutory reports.
- The page does not give confidence intervals or statistical significance tests.
Diagrams
Rendering diagram…
Screenshots
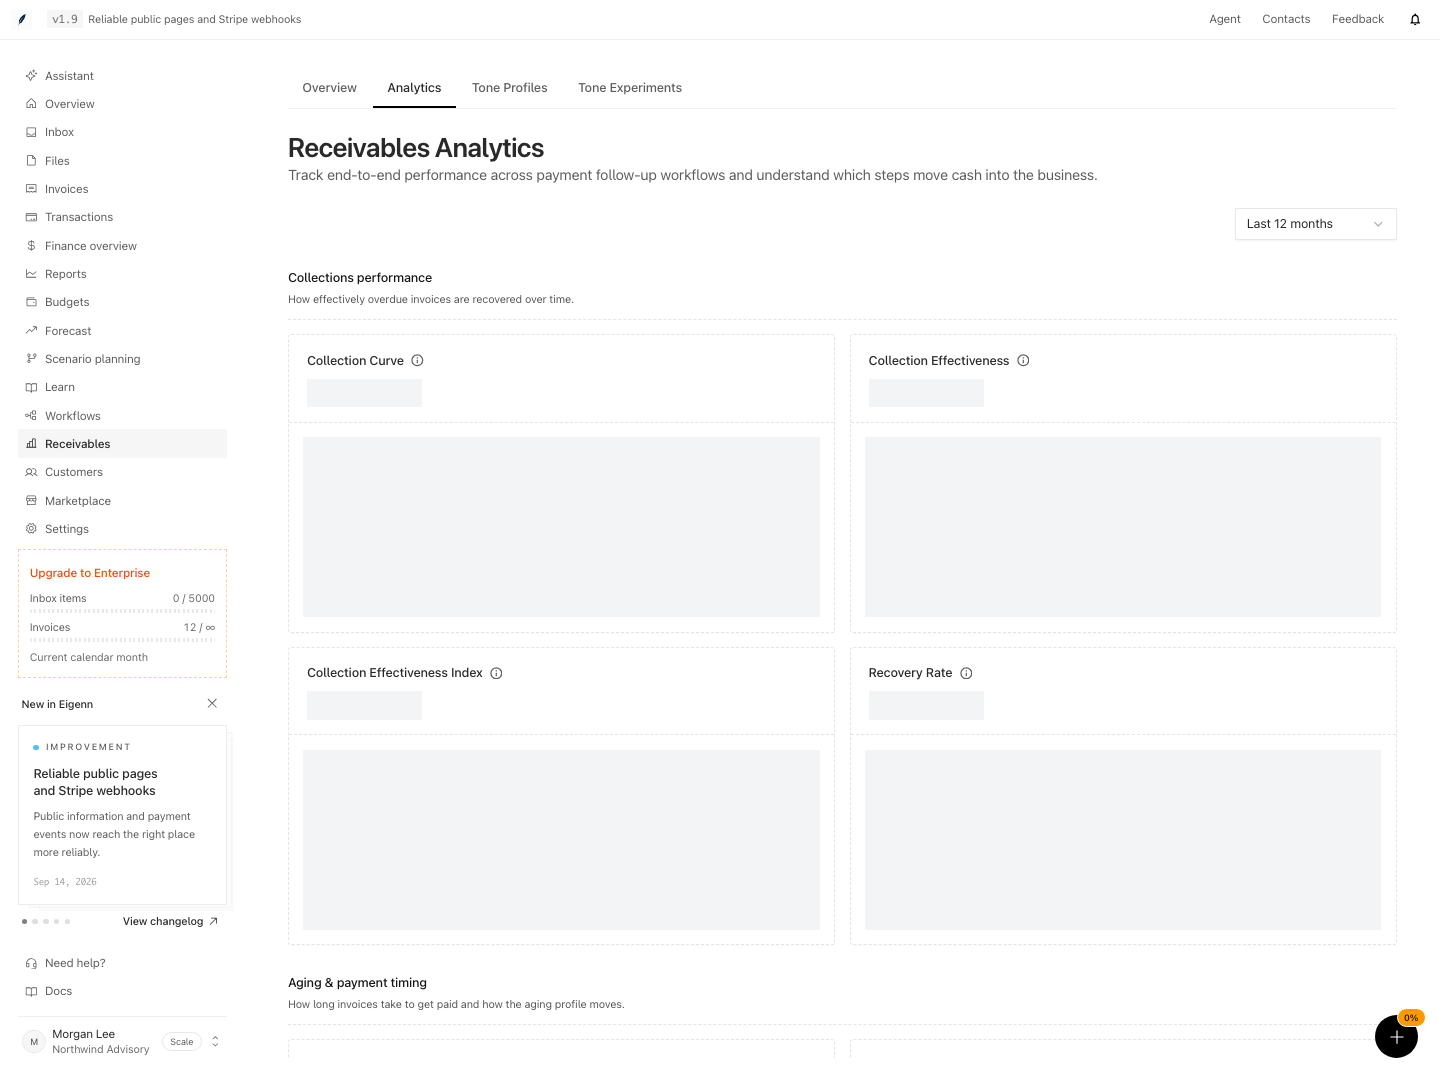
Shown with synthetic data in a local workspace.
Verification
Confirm the Result
Before you report a metric, confirm these points:
- The selected period is correct, and any currency label is interpreted using the table above.
- The source invoice count is non-zero.
- Paid invoices have both the correct status and the correct paid date.
- Issue and due dates are usable.
- You use the same currency or a reconciled conversion method.
- Recent corrections had time to appear.
- You know whether the card is current, period-based, or all-time.
Troubleshoot
A card shows no data
Expand the period. Then confirm the necessary invoice dates and statuses. New teams and periods with no payments that qualify can correctly return an empty result.
DSO has no result on a new team
Check positive transactions in the selected period as well as open invoices. Without a sales denominator the metric cannot be calculated; this is not zero-day collection.
The same period produces different totals across cards
The cards measure different populations. They use issue dates, payment dates, send dates, or current state; card expiry also uses its own forward window. Use the period reference table and the label below each card.
A multi-currency total looks too high
Separate invoices by currency in the invoice workspace. Reconcile them with an approved rate. Do not assume that every receivables card does the conversion.
A recent payment has not changed the chart
Confirm the invoice and the payment record. Then refresh. If the source record is correct, give the analytical aggregation time to update before you change it again.
- Select a known reporting period and confirm the expected invoice, transaction, payment, and communication cohorts using the table above.
- Where a card provides a count, inspect it. Confirm required records and dates for cards without population counts; zero or an empty state alone is inconclusive.
- Distinguish invoice status and paid date from successful payment records. A partial payment can affect Payment Lag and Collection Curve before an invoice is marked paid. Correct inconsistent records before comparing metrics.
- For multi-currency teams, reconcile by currency outside these cards. Do not expect raw mixed-currency aggregates to match a converted total.
- Refresh the dashboard after making invoice or payment edits. Corrections should be reflected provided that sufficient processing time has elapsed.
- Check known limitations: Collection Curve scaling, first-payment versus paid-date timing, positive-only Aging Movement, duplicate exposure, and no-history promise estimates. Record discrepancies before sharing conclusions.